Is Jev calibrated?
The same experiment as confidence.ipynb (OpenAI gpt-4o-mini + logprobs), redone with TypeSafe’s Jev:
20 Newsgroups posts, classified as mac / motor / baseball, then checked with reliability curves and ECE.
What is the same: the data (test split, random_state=42, first 500 posts, truncated to 500 characters), the F1 score, the per-class reliability curves, and ECE.
What is different:
- Jev’s Choice answer returns a probability for every option, so there is no logprob-token heuristic to map tokens back to classes.
- The API key is read from
TYPESAFE_API_KEY(or prompted for), never hardcoded. - The ECE function is fixed: the original silently dropped every prediction with probability exactly
1.0(the most overconfident ones). - Recalibration uses Platt scaling, scored out-of-fold, and the last section compares Jev (raw and recalibrated) with the OpenAI run.
All analysis uses Jev’s probabilities. Its confidence field is a rescaled peak of that distribution, not a probability of being correct, so it is saved but not used for calibration.
import os, sys, subprocess, getpass

try:
    import typesafe_sdk
except ModuleNotFoundError:
    subprocess.check_call([sys.executable, "-m", "pip", "install", "-q", "typesafe-sdk"])
    # pip may upgrade packages this kernel already imported (e.g. typing_extensions), so a restart is required
    raise RuntimeError("typesafe-sdk was just installed. Restart the kernel (Kernel > Restart) and run all cells again.")

if not os.environ.get("TYPESAFE_API_KEY"):
    os.environ["TYPESAFE_API_KEY"] = getpass.getpass("TypeSafe API key (create one at https://console.typesafe.ai/): ")

import numpy as np
import pandas as pd
import matplotlib.pyplot as plt
from concurrent.futures import ThreadPoolExecutor, as_completed
from sklearn import metrics
from sklearn.calibration import calibration_curve
from sklearn.datasets import fetch_20newsgroups
from sklearn.linear_model import LogisticRegression
from sklearn.model_selection import StratifiedKFold
from typesafe_sdk import Choice, TypeSafeClient, TypeSafeError
1. Data
MODEL = "jev-latest"
SAMPLE_SIZE = 500          # same as the OpenAI notebook
MAX_CHARS = 500            # same truncation as the OpenAI notebook
MAX_WORKERS = 8            # parallel requests; the SDK retries 429s with backoff
RESULTS_CSV = "jev_classification_results.csv"
FORCE_RECOMPUTE = False    # True = ignore the cached CSV and call the API again

categories_to_fetch = ['comp.sys.mac.hardware', 'rec.motorcycles', 'rec.sport.baseball']
simplified_names = ['mac', 'motor', 'baseball']
prob_cols = [f"prob_{n}" for n in simplified_names]

fetch_kwargs = dict(remove=('headers', 'footers', 'quotes'), categories=categories_to_fetch, shuffle=True, random_state=42)
newsgroups_train = fetch_20newsgroups(subset='train', **fetch_kwargs)
newsgroups_test = fetch_20newsgroups(subset='test', **fetch_kwargs)
assert list(newsgroups_test.target_names) == categories_to_fetch  # so target id i <-> simplified_names[i]

sample_data = newsgroups_test.data[:SAMPLE_SIZE]
y_true_sample = newsgroups_test.target[:SAMPLE_SIZE]
print(f"{len(sample_data)} test articles; class counts: {np.bincount(y_true_sample).tolist()}")
500 test articles; class counts: [163, 176, 161]
2. One Jev call
One Choice question. The option names are what the answer is keyed by, and their descriptions are sent to the model, so each one says what the newsgroup covers.
QUESTIONS = {
    "category": Choice(
        instructions="Which newsgroup was this post written in?",
        criteria={
            "mac": "Apple Macintosh computer hardware",
            "motor": "Motorcycles",
            "baseball": "Baseball",
        },
    )
}

def classify(client, article):
    """One Jev call -> (probability vector in simplified_names order, Jev confidence, model version)."""
    response = client.system_one(article[:MAX_CHARS], QUESTIONS, model=MODEL)
    answer = response.choices["category"]
    probs = np.array([answer.probabilities.get(n, 0.0) for n in simplified_names])
    return probs, answer.confidence, response.model

sample_article = newsgroups_train.data[20]
true_category = simplified_names[newsgroups_train.target[20]]

with TypeSafeClient() as client:
    response = client.system_one(sample_article[:MAX_CHARS], QUESTIONS, model=MODEL)
answer = response.choices["category"]

print(f"True category: {true_category}")
print(f"Jev choice:    {answer.choice}  (confidence {answer.confidence:.3f}, model {response.model})")
display(pd.Series(answer.probabilities, name="probability").sort_values(ascending=False).to_frame())
3. Classify the sample
Results are written to jev_classification_results.csv as soon as the calls finish, and reused on later runs (set FORCE_RECOMPUTE = True to redo them). Failed calls are counted and excluded, like the invalid predictions in the OpenAI notebook.
def run_one(client, i, article):
    try:
        probs, confidence, model = classify(client, article)
        return i, probs, confidence, model, None
    except TypeSafeError as e:
        return i, None, None, None, repr(e)

if os.path.exists(RESULTS_CSV) and not FORCE_RECOMPUTE:
    print(f"Using cached results from {RESULTS_CSV}")
else:
    rows, errors = [], {}
    print(f"Starting Jev calls for {len(sample_data)} articles...")
    with TypeSafeClient() as client, ThreadPoolExecutor(MAX_WORKERS) as pool:
        futures = [pool.submit(run_one, client, i, a) for i, a in enumerate(sample_data)]
        for done, future in enumerate(as_completed(futures), 1):
            i, probs, confidence, model, error = future.result()
            if error:
                errors[i] = error
            else:
                rows.append({"article_idx": i, "y_true_final": int(y_true_sample[i]),
                             **dict(zip(prob_cols, probs)), "confidence": confidence, "model": model})
            if done % 50 == 0:
                print(f"Processed {done}/{len(sample_data)} articles.")

    if not rows:
        raise RuntimeError(f"Every Jev call failed. First error: {next(iter(errors.values()))}")
    pd.DataFrame(rows).sort_values("article_idx").to_csv(RESULTS_CSV, index=False)
    print(f"Saved {len(rows)} results to {RESULTS_CSV}; {len(errors)} calls failed.")
    if errors:
        print("First errors:", list(errors.values())[:3])

results_df = pd.read_csv(RESULTS_CSV)
print(f"Model version(s): {results_df['model'].unique().tolist()}")
Using cached results from jev_classification_results.csv
Model version(s): ['jev-1.13.0']
4. Macro F1
y_true = results_df["y_true_final"].to_numpy()
P = results_df[prob_cols].to_numpy()          # (n_samples, 3) probabilities straight from Jev
y_pred = P.argmax(axis=1)

f1_jev = metrics.f1_score(y_true, y_pred, average="macro")
print("==================================================")
print(f"Macro F1 (Jev): {f1_jev:.4f}   accuracy: {(y_pred == y_true).mean():.4f}")
print(f"(Calculated on {len(y_true)} valid predictions out of {SAMPLE_SIZE})")
print("==================================================")
==================================================
Macro F1 (Jev): 0.9186   accuracy: 0.9180
(Calculated on 500 valid predictions out of 500)
==================================================
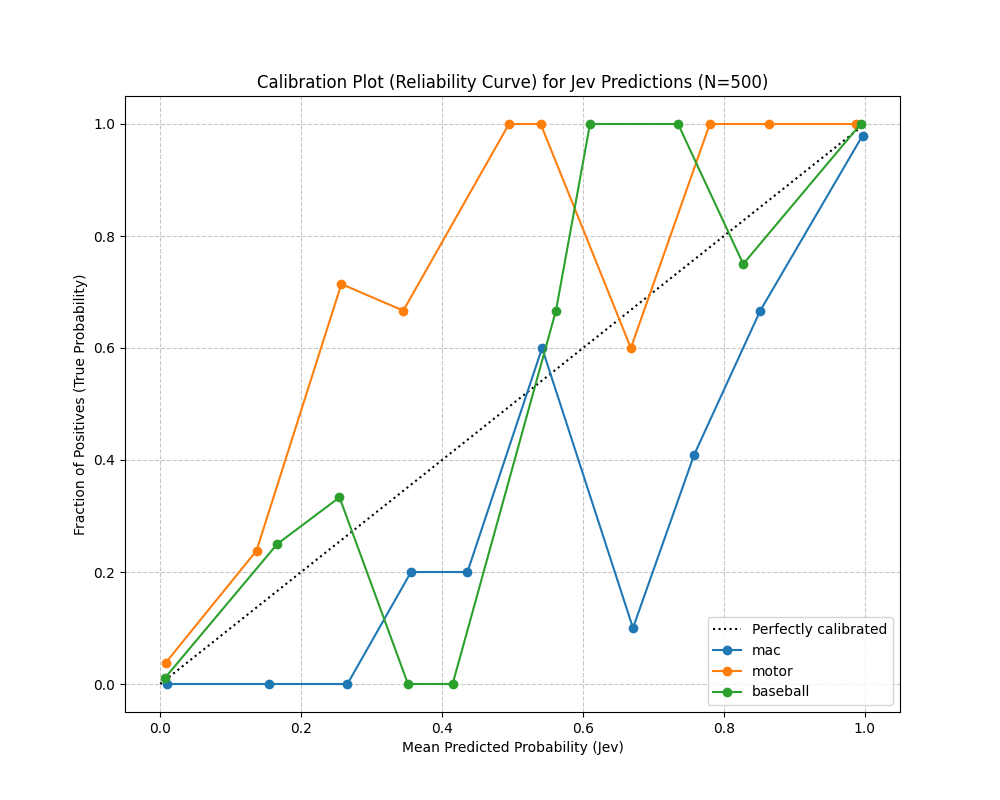
5. Calibration plot (per class, one-vs-rest)
fig, ax = plt.subplots(figsize=(10, 8))
ax.plot([0, 1], [0, 1], "k:", label="Perfectly calibrated")

for i, name in enumerate(simplified_names):
    fraction_of_positives, mean_predicted_value = calibration_curve(y_true == i, P[:, i], n_bins=10)
    ax.plot(mean_predicted_value, fraction_of_positives, "o-", label=name)

ax.set_xlabel("Mean Predicted Probability (Jev)")
ax.set_ylabel("Fraction of Positives (True Probability)")
ax.set_title(f"Calibration Plot (Reliability Curve) for Jev Predictions (N={len(y_true)})")
ax.legend(loc="lower right")
ax.grid(True, linestyle="--", alpha=0.7)
plt.savefig("jev_calibration_plot.png")
plt.show()
6. Expected Calibration Error
Same definition as the original notebook, with one fix: np.digitize puts a probability of exactly 1.0 in bin index 10, which the loop never visits, so those predictions were dropped from the average. Jev (like the OpenAI mapping) returns many exact 0.0/1.0 values, and the 1.0 ones are where overconfidence shows up, so they have to be counted.
def expected_calibration_error(y_true, prob_pred, n_bins=10):
    y_true, prob_pred = np.asarray(y_true), np.asarray(prob_pred)
    bins = np.linspace(0, 1, n_bins + 1)
    binids = np.clip(np.digitize(prob_pred, bins) - 1, 0, n_bins - 1)   # p == 1.0 goes in the last bin
    ece = 0.0
    for b in range(n_bins):
        mask = binids == b
        if mask.any():
            ece += abs(y_true[mask].mean() - prob_pred[mask].mean()) * mask.sum() / len(y_true)
    return ece

for i, name in enumerate(simplified_names):
    ece = expected_calibration_error((y_true == i).astype(int), P[:, i])
    print(f"ECE for '{name}': {ece * 100:.2f}%")
ECE for 'mac': 5.34%
ECE for 'motor': 4.50%
ECE for 'baseball': 1.96%
Helper used by the tables below. Top-label ECE asks whether the probability given to the predicted class matches how often that prediction is right (with a bootstrap 95% interval). Per-class ECE alone looks good when most probabilities are near 0, and ECE is biased upward at a few hundred samples, so read the interval before calling a difference real. acc p>=0.99 is the direct test of “a probability of 1.0 should be right every time”.
N_CLASSES = len(simplified_names)

def summarize(name, y, P, n_boot=1000, seed=0):
    y_pred, top_prob = P.argmax(axis=1), P.max(axis=1)
    correct = (y_pred == y).astype(int)
    rng = np.random.default_rng(seed)
    boots = [expected_calibration_error(correct[idx], top_prob[idx])
             for idx in (rng.integers(0, len(y), len(y)) for _ in range(n_boot))]
    lo, hi = np.percentile(boots, [2.5, 97.5]) * 100
    sure = top_prob >= 0.99
    row = {
        "model": name,
        "n": len(y),
        "accuracy": correct.mean(),
        "macro F1": metrics.f1_score(y, y_pred, average="macro"),
        "mean top prob": top_prob.mean(),
        "top-label ECE %": expected_calibration_error(correct, top_prob) * 100,
        "95% CI": f"[{lo:.1f}, {hi:.1f}]",
        "Brier": np.mean(np.sum((P - np.eye(P.shape[1])[y]) ** 2, axis=1)),
        "n p>=0.99": int(sure.sum()),
        "acc p>=0.99": correct[sure].mean() if sure.any() else np.nan,
    }
    for i, c in enumerate(simplified_names):
        row[f"ECE {c} %"] = expected_calibration_error((y == i).astype(int), P[:, i]) * 100
    return row
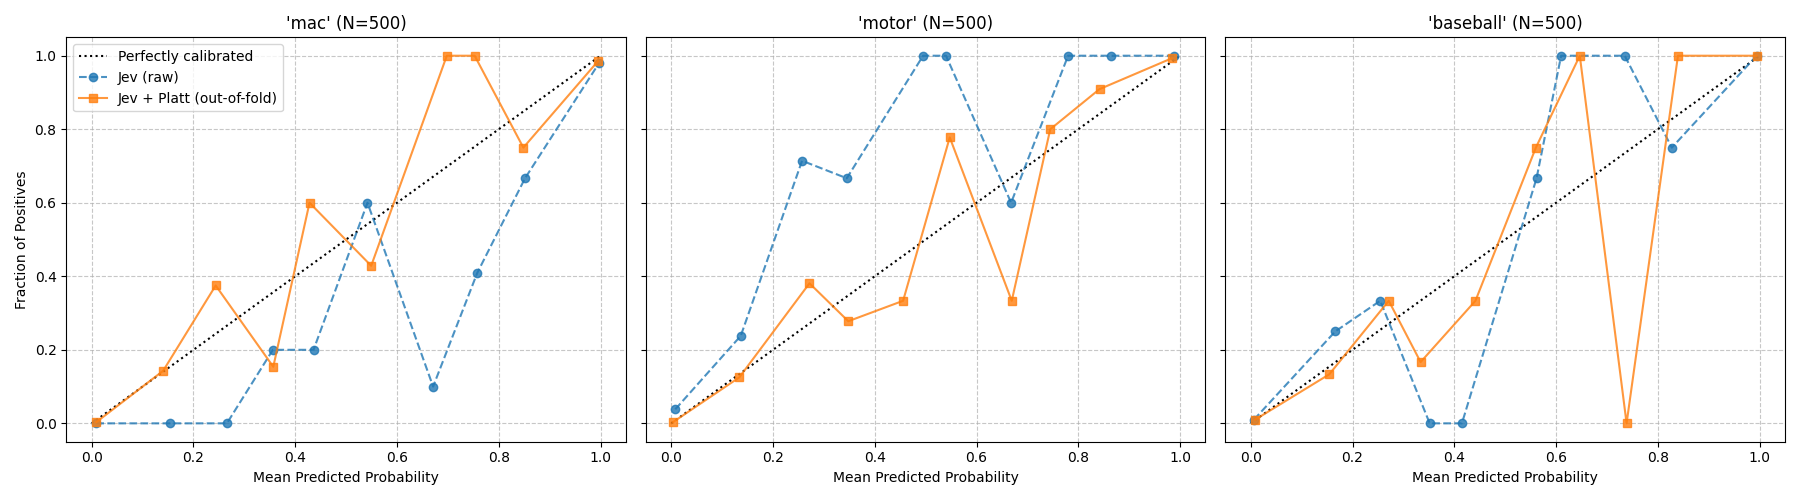
7. Platt recalibration
Platt scaling fits one sigmoid per class on the logit of Jev’s probability (2 parameters per class), then renormalises the rows to sum to 1.
It is scored out-of-fold: with 5-fold cross-validation each article is recalibrated by a model that never saw it, so all ~500 articles count and nothing is scored on the data it was fitted on. Probabilities of exactly 0 or 1 are clipped to 1e-6 first, because the logit of 0 or 1 is infinite.
EPS = 1e-6

def _logit(p):
    p = np.clip(p, EPS, 1 - EPS)
    return np.log(p / (1 - p))

def fit_platt(P_fit, y_fit):
    return [LogisticRegression(C=1e3).fit(_logit(P_fit[:, [k]]), (y_fit == k).astype(int))
            for k in range(P_fit.shape[1])]

def apply_platt(models, P_new):
    cal = np.column_stack([m.predict_proba(_logit(P_new[:, [k]]))[:, 1] for k, m in enumerate(models)])
    totals = cal.sum(axis=1, keepdims=True)
    return np.where(totals > 0, cal / np.where(totals > 0, totals, 1), 1 / cal.shape[1])

def out_of_fold_platt(P, y, n_splits=5, seed=42):
    out = np.zeros_like(P)
    for fit_idx, test_idx in StratifiedKFold(n_splits, shuffle=True, random_state=seed).split(P, y):
        out[test_idx] = apply_platt(fit_platt(P[fit_idx], y[fit_idx]), P[test_idx])
    return out

P_platt = out_of_fold_platt(P, y_true)

fig, axes = plt.subplots(1, N_CLASSES, figsize=(18, 5), sharey=True)
for i, (name, ax) in enumerate(zip(simplified_names, axes)):
    ax.plot([0, 1], [0, 1], "k:", label="Perfectly calibrated")
    for probs, style, label in [(P, "o--", "Jev (raw)"), (P_platt, "s-", "Jev + Platt (out-of-fold)")]:
        frac, mean_p = calibration_curve(y_true == i, probs[:, i], n_bins=10)
        ax.plot(mean_p, frac, style, label=label, alpha=0.8)
    ax.set_title(f"'{name}' (N={len(y_true)})")
    ax.set_xlabel("Mean Predicted Probability")
    ax.grid(True, linestyle="--", alpha=0.7)
axes[0].set_ylabel("Fraction of Positives")
axes[0].legend(loc="upper left")
plt.tight_layout()
plt.savefig("jev_platt_calibration_plot.png")
plt.show()

print(f"Accuracy: raw {(P.argmax(1) == y_true).mean():.4f} | Platt {(P_platt.argmax(1) == y_true).mean():.4f}")
for i, name in enumerate(simplified_names):
    before = expected_calibration_error((y_true == i).astype(int), P[:, i]) * 100
    after = expected_calibration_error((y_true == i).astype(int), P_platt[:, i]) * 100
    print(f"ECE '{name}': {before:.2f}% -> {after:.2f}% after Platt")
Accuracy: raw 0.9180 | Platt 0.9260
ECE 'mac': 5.34% -> 2.23% after Platt
ECE 'motor': 4.50% -> 2.10% after Platt
ECE 'baseball': 1.96% -> 1.87% after Platt
8. Comparison with the OpenAI run
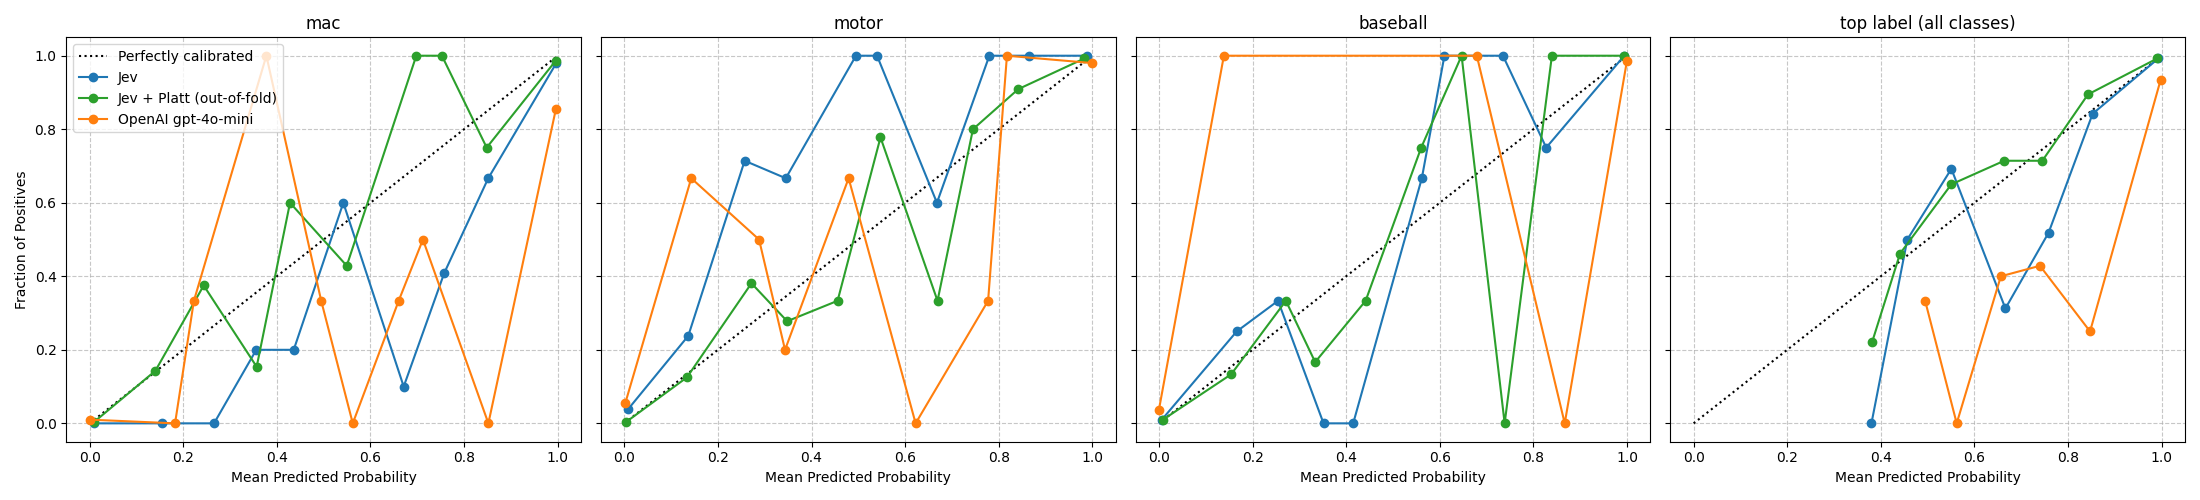
openai_classification_results.csv does not keep the article index (and has 496 valid rows), so the OpenAI run is a different sample of the same distribution: compare it as a reference rather than row by row. Its probabilities come from the first-token logprob heuristic in confidence.ipynb, renormalised over the matched tokens; Jev’s are its native probabilities.
runs = {
    "Jev": (y_true, P),
    "Jev + Platt (out-of-fold)": (y_true, P_platt),
}
if os.path.exists("openai_classification_results.csv"):
    openai_df = pd.read_csv("openai_classification_results.csv")
    runs["OpenAI gpt-4o-mini"] = (openai_df["y_true_final"].to_numpy(), openai_df[prob_cols].to_numpy())
else:
    print("openai_classification_results.csv not found; showing Jev only.")

summary = pd.DataFrame([summarize(name, y, probs) for name, (y, probs) in runs.items()]).set_index("model")
display(summary.round(3))
| metric | Jev | Jev + Platt (out-of-fold) | OpenAI gpt-4o-mini |
|---|---|---|---|
| n | 500 | 500 | 496 |
| accuracy | 0.918 | 0.926 | 0.911 |
| macro F1 | 0.919 | 0.926 | 0.913 |
| mean top prob | 0.942 | 0.920 | 0.986 |
| top-label ECE % | 3.524 | 1.248 | 7.454 |
| 95% CI | [2.5, 5.8] | [1.1, 3.4] | [5.4, 9.8] |
| Brier | 0.115 | 0.099 | 0.154 |
| n p>=0.99 | 356 | 328 | 451 |
| acc p>=0.99 | 0.997 | 0.997 | 0.967 |
| ECE mac % | 5.338 | 2.232 | 6.813 |
| ECE motor % | 4.498 | 2.102 | 5.224 |
| ECE baseball % | 1.962 | 1.868 | 3.437 |
colors = {"Jev": "tab:blue", "Jev + Platt (out-of-fold)": "tab:green", "OpenAI gpt-4o-mini": "tab:orange"}
fig, axes = plt.subplots(1, N_CLASSES + 1, figsize=(22, 5), sharey=True)

for ax, title in zip(axes, [*simplified_names, "top label (all classes)"]):
    ax.plot([0, 1], [0, 1], "k:", label="Perfectly calibrated")
    ax.set_title(title)
    ax.set_xlabel("Mean Predicted Probability")
    ax.grid(True, linestyle="--", alpha=0.7)

for name, (y, probs) in runs.items():
    for i in range(N_CLASSES):
        frac, mean_p = calibration_curve(y == i, probs[:, i], n_bins=10)
        axes[i].plot(mean_p, frac, "o-", color=colors[name], label=name)
    frac, mean_p = calibration_curve(probs.argmax(1) == y, probs.max(1), n_bins=10)
    axes[-1].plot(mean_p, frac, "o-", color=colors[name], label=name)

axes[0].set_ylabel("Fraction of Positives")
axes[0].legend(loc="upper left")
plt.tight_layout()
plt.savefig("jev_vs_openai_calibration.png")
plt.show()